Seismograms from North Korea
There’s one basic difference between earthquakes and explosions. Earthquakes happen when two pieces of rock slide against each other; they generate both push-pull and side-to-side waves. Explosions, by contrast, just push everything outward in all directions.
We can tell the difference between push, pull, and side-to-side motions on a seismogram, so detecting explosions should be easy, right? Sort of. When a real bomb goes off underground, the explosion creates a cavity where the rock has been pushed out… and the rock immediately falls back in, generating all sorts of confounding waveforms. The details of this process, as well as the amount of energy that gets turned into seismic waves rather than, say, a big loud bang, or trinitite, are dependent on the geology of the test site.
Anyway, I’ve seen some people clamoring for seismograms. Seismic data from the event recorded on Global Seismic Network stations are freely available from IRIS, but the software seismologists use to process them is only available to people affiliated with an IRIS institution.
Lucky me. I downloaded the seismograms for the half-dozen closest stations, but wasn’t able to get much interesting information out of them. You can see the problem if you look at this figure from IRIS – except for the closest station, MDJ, the signal from the test doesn’t stand out very far above the noise at all. It’s possible that a someone with really hardcore filter-fu could pull out a better-looking signal than that, but that person is certainly not me.
So let’s just look at the vertical motion recorded at the closest GSN station, MDJ, in northeastern China (zooming in on the P and S wave arrivals; there’s a ton of grumbling surface wave stuff that comes in after this, but we don’t really care about that right now):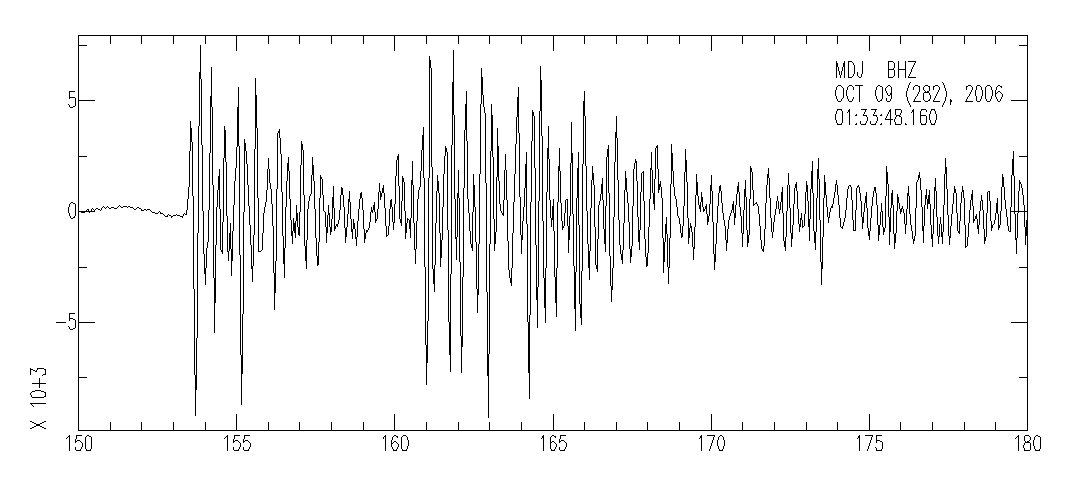
Here I’ve done a causal high-pass filter at 4Hz, and zoomed in on the P and S arrivals: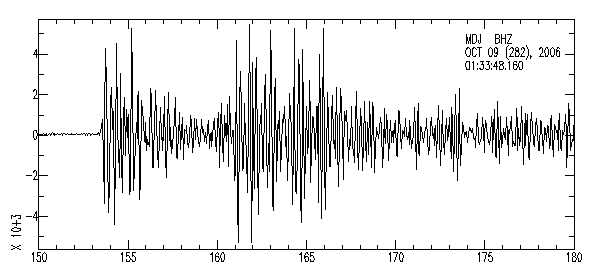
Same thing, low-passed at 4Hz this time: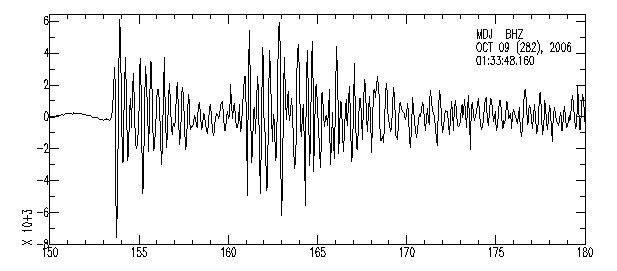
Note that I have not removed the instrument response from these records; for a broadband station like MDJ, I might be able to get away with this, but it’s possible that some features are amplified or obscured on the seismogram because I haven’t properly accounted for the way the waves are actually recorded. I tried, but for some reason it comes out all wonky and I can only fuss so much. But, the instrument response won’t change the direction of first motion, which is up – i.e., compression, and consistent with an explosive source (though hardly indicative, I’d need to look at seismograms from many different places around the globe to say that).
At this point, though, the scientific and political controversy isn’t about whether or not this was an explosion. For reasons Lab Lemming has outlined, we don’t expect an earthquake as shallow as the event observed on Sunday to occur in that part of North Korea. It’s not impossible, of course, but the tectonic setting is all wrong, and no similar shallow events have been observed in the area before. We have satellite photos of dubious goings-on near the test site, and it seems likely that this really was a manmade event. No, we’re interested in the size of the event, and how that relates to the size of the explosion.
There are many different measures of seismic event size. Then, once you get an event size, there are many different ways of transforming that into a weapon yield. However, I’m beginning to worry that I’ll never publish this post, so I’ll put off that part of the discussion until later… now, I’m off to school.
ruth wrote:
When we moved to Santa Fe (2020), the first neighbor we met worked at LANL in “treaty verification.” He told us that there is no way to verify by siesograms, alone- that they rely on satellite photography of ground activity, etc, to get the big picture.
Mel also did aurora borealis research- used to go up to U of Alaska to fire off rockets loaded with some element (‘ve forgotten which one) during an aurora event to observe aurora behavior.
Posted 12 Oct 2020 at 9:25 am 
yami wrote:
Heh. One of my professors told a story about back in the Cold War – we knew the Russians had staggeringly good estimates of the yield on our weapons tests, and seismologists were frantic trying to figure it out. Turns out they were looking at satellite photos and counting the number/length of cables laid out on the ground before the test…
Posted 12 Oct 2020 at 1:10 pm 
Lab Lemming wrote:
Perhaps the cable method is what caused the Russians to originally overestimate the yield of the North Korea blast. After all, that method assumes some correlation between the expected and actual yield.
Posted 13 Oct 2020 at 12:45 am 
Gengar wrote:
I was wondering if the Russians were just using data from their own nuclear tests to extrapolate the yield from the size of the earthquake.
As it is, the combination of a weak signal, and no idea of the test set-up or the local geology (and maybe even the bomb design would make a difference) means that an estimate is going to have some rather large errors… not that that’s being reported of course.
Posted 13 Oct 2020 at 2:14 am 